Week 09 Geodata
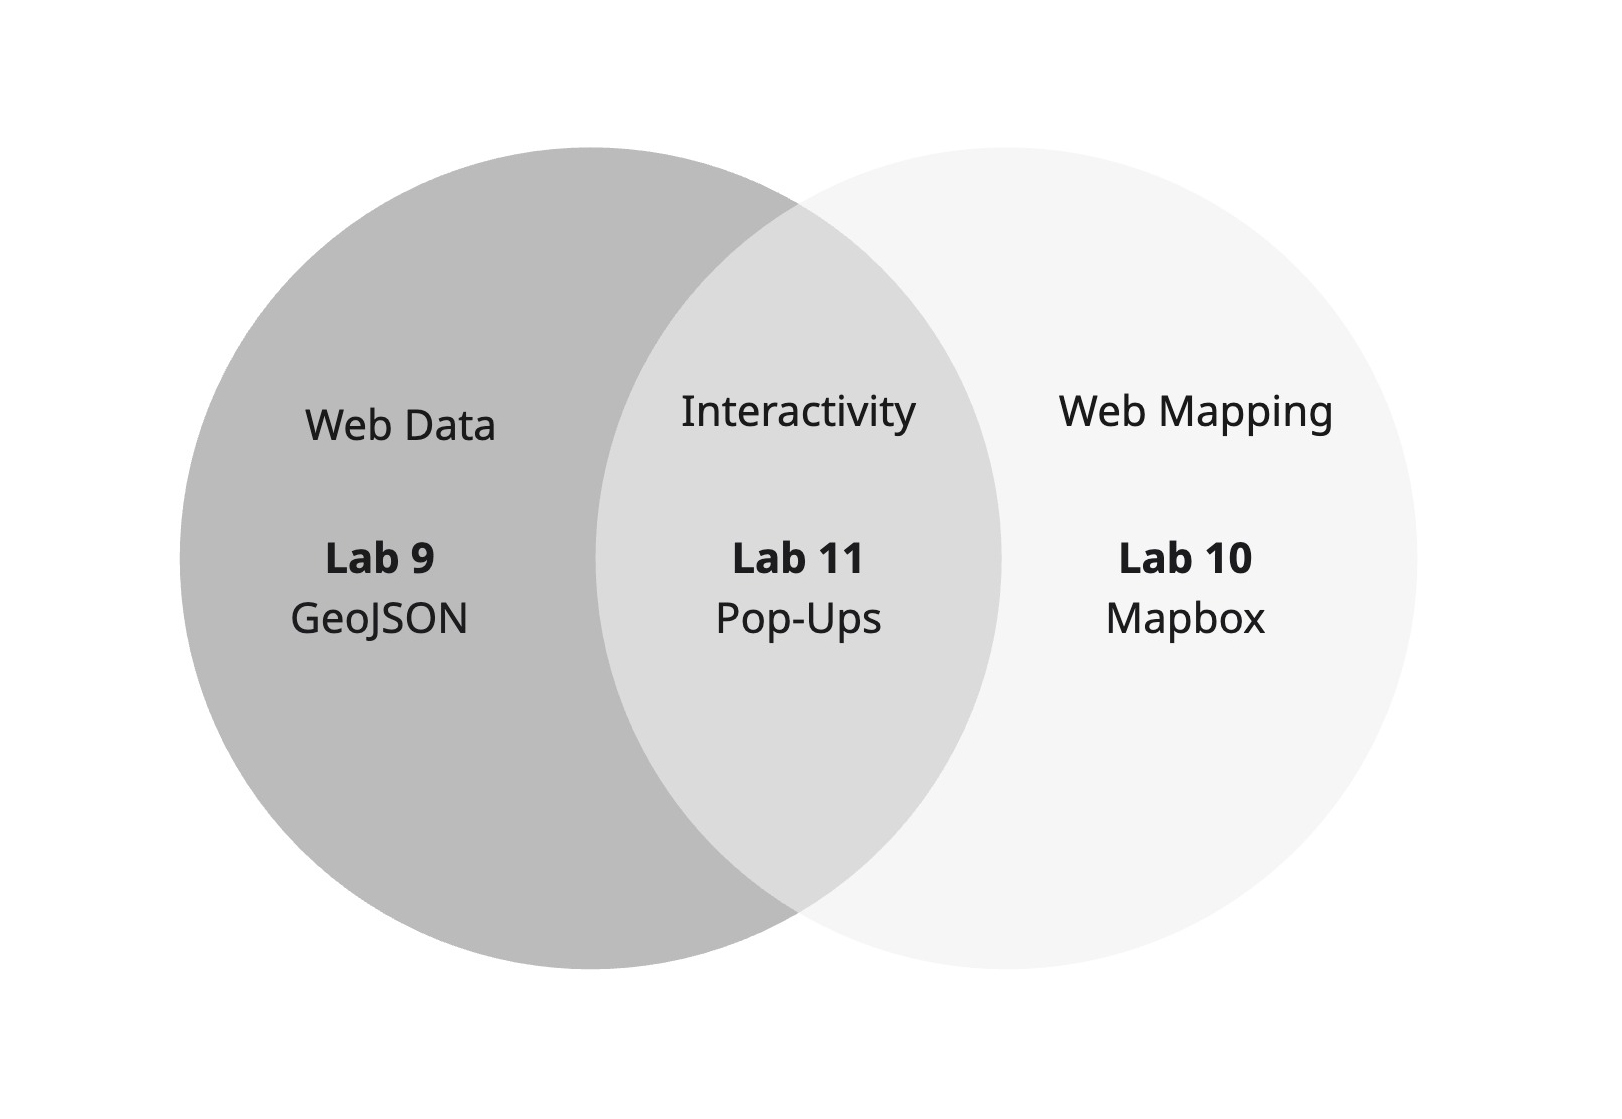
Now we are going to move onto Web Mapping. Web Mapping is a combination of data visualization and cartography, so we are going to start by making our own data, then move on from there. It's a bit like this:
As such, this exercise asks you to:
- digitize historic landmarks from the Berkeley Architectural Heritage Association (BAHA), and;
- set up Github as a host for this data, and your future web map.
We will be using geoJSON as the key data format.
Foundations Pathway 
For Tech-Tortoises
This pathway is for those who want to go through slowly and carefully, learning the fundamentals and foundations of web mapping.
If you're technologically nervous, or like lots of instructions, choose this path!
Create Your GeoJSON
This tasks asks you to manually geolocate 10 data points from the BAHA.
Find your Data
First, let's find some data!
Open your web browser
In one tab, Tab-BAHA go to https://berkeleyheritage.com/berkeley_landmarks/all_landmarks.html
In another tab, Tab-JSON, go to https://geojson.io
In Tab-BAHA on the BAHA Site, select 10 buildings you would like to digitize.
Start Digitizing
Next, let's make it spatial!
In Tab-BAHA, copy (Ctrl+C) the street address from the table.
In Tab-JSON, paste (Ctrl+V) the street address in the search bar. This should take you to the address in Berkeley. If not, you may need to find it on the map.
Select the "Point" marker from the toolbar on the right - when you toggle, it says Draw Point (m) - or press M on the keyboard.
Place the marker on the map.
Add Attributes
Now, we need to add in some attribute data to describe the points
Still in Tab-JSON, now select the tab on the right-hand side which says Table.
Then select new column
In the new column pop-up, write "Landmark"
Repeat this step for the following categories:
- "Address"
- "Architect + Date"
- "Link"
- "Designated"
- "Notes"
Then copy (Ctrl+C) and paste (Ctrl+V) the information for each of the categories.
Fill out your GeoJSON Feature Collection
Since you're a wizz at creating data, repeat these steps for each of the 9 remaining addresses:
Search for the address
Select the point tool
Make a point
Fill Out the Column Data
Warning
Don't forget to save periodically to avoid losing your work. geojson.io has become finicky recently, but we haven't found a better replacement. To do this choose Save > geoJSON. Tell your instructor if you're one of the first to do this, so we can see where it is saving.
Export your GeoJSON
When you're done, you're ready to export your GeoJSON for the final time.
Go to Save and choose geoJSON
Find the location of the last geojson you saved, and rename it 183data.geojson. Don't close the folder.
Set up your Github
Now we need somewhere to put your new .geojson file! Github is a free repository where we can put code and share it with other people - one of the cornerstones of open source (for free) software development. It has the added bonus of also being a web-publisher, where we can actually host relatively sophisticated websites.
Sign Up to Github
First, we need to sign up to Github.
In your browser, create a new window or tab, and navigate to https://github.com/
On the top-right of the page, select Sign Up. I like to use my Berkeley credentials, but you may want to use your personal email as well.
Set Up A Repository
Let's set up a repository to hold your hard-earned data.
In the upper-right corner of any page, select, then click New repository.

In the "Repository name" box, type BAHA Map
In the "Description" box, type a short description. For example, type "This repository is for the BAHA Map"
Select Public for your repository.
Select Add a README file.
Click Create repository.
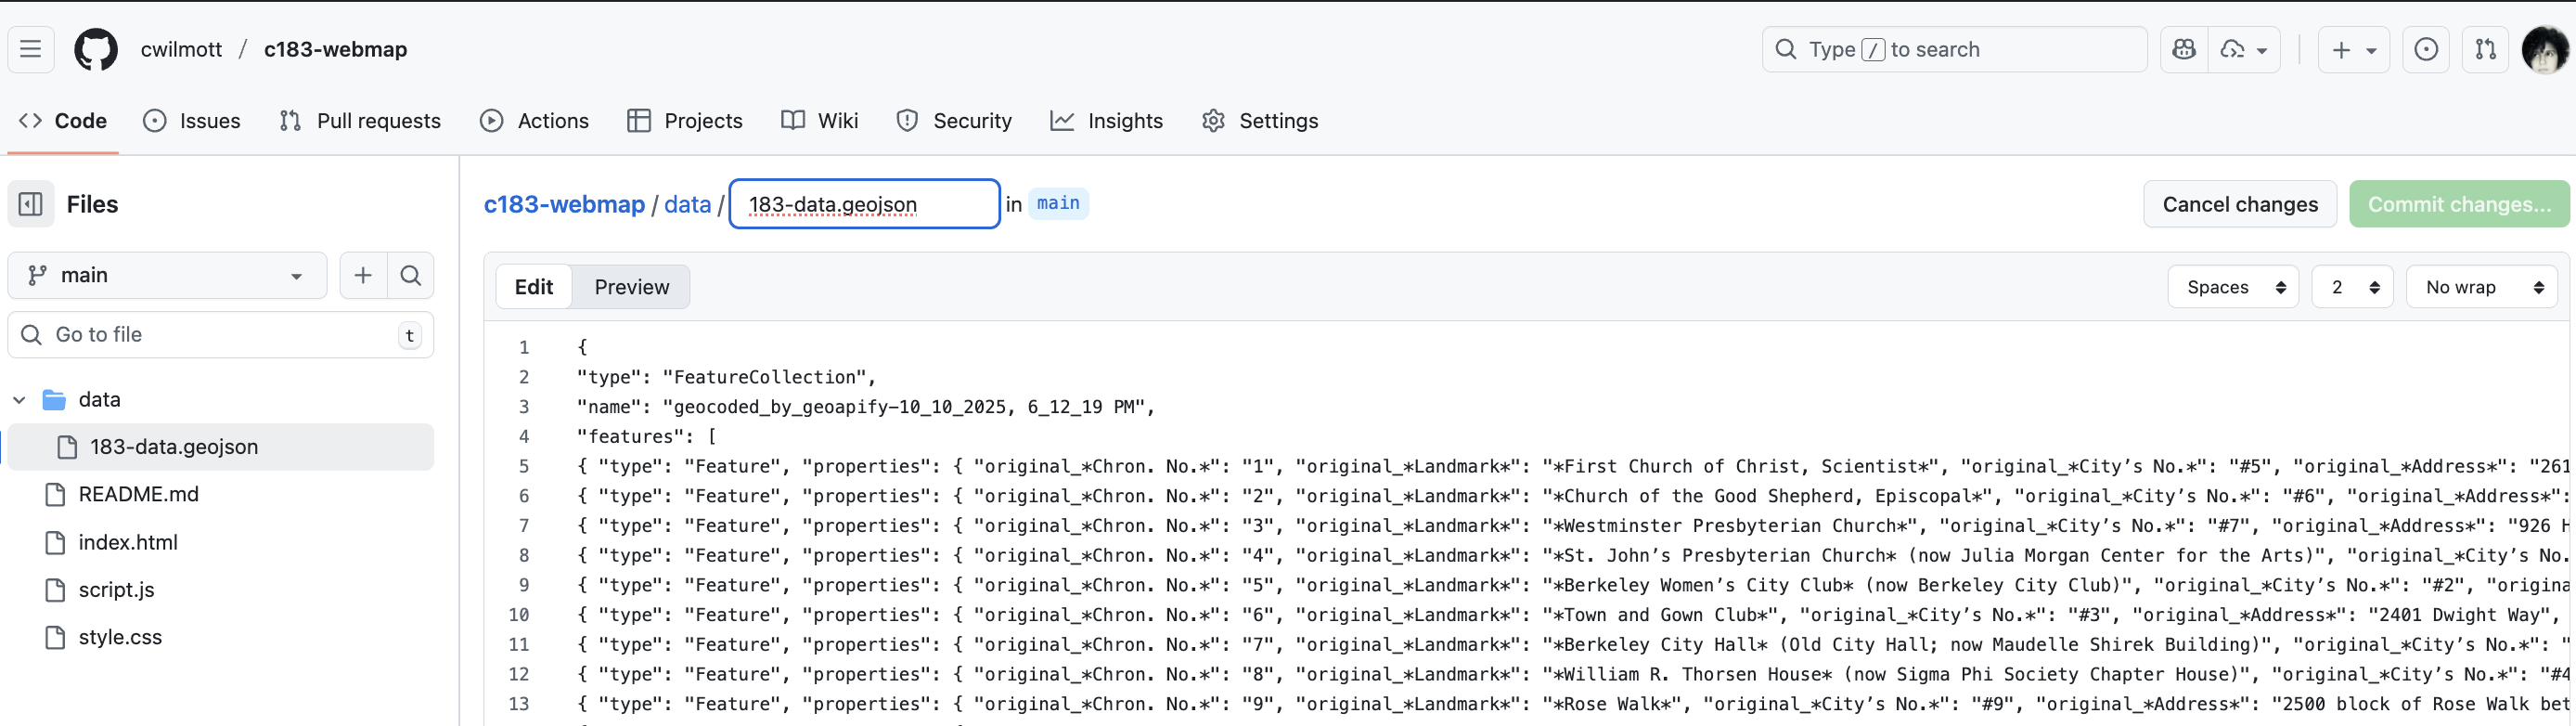
Add your Data
Now that you have your Github account up and running, we need to create a basic file structure to house your data. It's not hard.
So far, you should only see one file listed in the repository, the README.md file you created when you initialized the repository. Now, we'll upload some of our own files.
To the right of the page, select the Add file dropdown menu.
From the dropdown menu, click Upload files.
On your computer, return to the the folder containing your 183data.geojson file, then drag and drop it into the browser.
At the bottom of the page, under "Commit changes", select "Commit directly to the main branch, then click Commit changes.
Tidy Your Files
We don't want this to be in the main section because it's untidy (and you might end up with many more data files!), so we want to make a new folder.
To do this, you need to select the 183data.geojson file.
Then, select the "Edit" icon to edit this file.

Then, locate the file structure bar at the top.
Copy and paste (or write directly) /data into the file structure bar
Publish to Web Using Github Pages
Finally, we can publish to the web using Github pages so we can share our data.
Under your repository name, click Settings. If you cannot see the "Settings" tab, select the dropdown menu, then click Settings.

In the "Code and automation" section of the sidebar, click Pages.
Under "Build and deployment", under "Source", select Deploy from a branch.
Under "Build and deployment", under "Branch", use the branch dropdown menu and select main.

Visit username.github.io to view your new website. Note that it can take up to 10 minutes for changes to your site to publish after you push the changes to GitHub.
Experimental Pathway 
For Tech-Hares
This pathway is for students who love to bash at things until they work, and run before they can walk. If you have low attention spans and lots of tech confidence, this is the pathway for you.
Scrape + Clean Data
This pathway asks you to scrape and clean data from the BAHA website, rather than manually create a dataset.
Examine the Code Structure.
The first thing you need to do is examine the HTML code structure: how is the data you'd like to scrape structured?
Go to the BAHA website at https://berkeleyheritage.com/berkeley_landmarks/all_landmarks.html
Choose a list of 100 sites and click.
Right-click on the table with the data and select Inspect, View Page Source, Developer Tools - or similar.
You will see that the code is nested in a <table> tag, with sub-tags <td> and <tr>. This means that the data is structured as a table within the HTML page.
Scrape Data
There are lots (and lots!) of ways to scrape data (hit Clancy up if you'd like to know more and you're good at .py), but one of the easiest is actually using Google Sheets. Since the data is in a table, we can use the IMPORTHTML function.
Create a Google Sheet
Select the top left corner cell
Then, use the IMPORTHTML function to scrape the data following the syntax here: https://support.google.com/docs/answer/3093339?hl=en . See if you can figure out how to format the syntax on your own first, otherwise, here is a hint (1)
- Functions start with
=. This worked for me:=IMPORTHTML("https://berkeleyheritage.com/berkeley_landmarks/landmarks1-100.html", "table", 1, "en_US")
Geocode the Data
Now that you [should] have the data imported as a table, you can start to work with the data. If you're familar with python, you may find it easier to do this using data wrangling, but honestly, if someone has made a decent tool already, why not start there? We're going to use a few free web tools to help us manage our data.
Start by exporting your new Feature Collection to .csv
Then, we need to geocode the address data into x and y coordinates. To do this, while ArcGIS and QGIS both have geocoders, it's sometimes easier to find a lighter solution online. Have a look around and see what you can find. This one worked okay for me https://www.geoapify.com/tools/geocoding-online/. If you'd like to learn more about how geocoding works, see https://www.mapbox.com/insights/geocoding
ArcGIS Detour
Benny has pointed out another pathway for geocoding if you're not happy with the results from the free geocoding tools. You can use the Address Points dataset here https://data.acgov.org/search?q=Address%20points . He writes, once in ArcGIS, then "drag and drop it into the catalog pane, and it should automatically appear as an option in the "geocode addresses" tool. If your address is in separate fields, you put the address number in "Address1," the street name in "Address2," and the street type in "Address3", and leave county and neighborhood blank. I get a ~95+% match rate with my dataset of all registered voters in Alameda County." Have fun!
Convert the Data
For some reason, you can't just easily open the geocoded CSV into
There are lots of good csv to geoJSON converters out there. Again, have a search, but this one worked for me (the Czech are great for open source tools). I used this one: https://mygeodata.cloud/converter/csv-to-geojson
Export and Save
Now you should be able to upload the data to geojson.io, using the "Open" option.
Clean the data as you see fit, and then Save > geoJSON
Locate the downloaded file, and rename it to 183data.geosjon
Set up your Github
Sign up to Github, and create a new Repository: https://docs.github.com/en/repositories/creating-and-managing-repositories/quickstart-for-repositories
Build your File Structure
Once you've set up your Github Repository, you'll need to add a folder to the repositoy to put your 183data.geojson file in. So far, you should only see one file listed in the repository, the README.md file you created when you initialized the repository. Now, we'll upload some of our own files.
To the right of the page, select the Add file dropdown menu.
From the dropdown menu, click Upload files.
On your computer, return to the the folder containing your 183data.geojson file, then drag and drop it into the browser.
At the bottom of the page, under "Commit changes", select "Commit directly to the main branch, then click Commit changes.
We don't want your 183data.geojson file to be in the main section because it's untidy (and you might end up with many more data files!), so we want to make a new folder to hold your data.
To do this, you need to select the 183data.geojson file.
Then, select the "Edit" icon to edit this file.
Then, locate the file structure bar at the top.
Copy and paste (or write directly) /data into the file structure bar
Publish to Web
Finally, we can publish to the web using Github pages so we can share our data.
Under your repository name, click Settings. If you cannot see the "Settings" tab, select the dropdown menu, then click Settings.
In the "Code and automation" section of the sidebar, click Pages.
Under "Build and deployment", under "Source", select Deploy from a branch.
Under "Build and deployment", under "Branch", use the branch dropdown menu and select main.
Visit username.github.io to view your new website. Note that it can take up to 10 minutes for changes to your site to publish after you push the changes to GitHub.
Make A Basic HTML Page
If you're feeling confident, and you still have 15-30 mins left, you can start messing around with HTML.
Code Pen is a good place to start, alongside W3 Schools. See if you can figure out how to style text, and add links. This will be useful for Lab 10.